|
The Carmel River Watershed Conservancy (CRWC) recently launched an interactive digital story map of its Carmel River Watershed Health Report Card at the Monterey Peninsula Regional Park District Discovery Center, open Saturday and Sunday 10-4PM. This story map highlights several watershed health indicators and explains how they are calculated, accompanied by photos of our diverse wildlife and watershed. The story map will be updated with new indicators later this year. CRWC in partnership with the CSUMB Watershed Institute recently updated three previous indicators: River to Floodplain Connectivity, Unimpaired Streamflow and Tributary Streamflow. The two streamflow indicators were modified to be Dry-season Streamflow and Wet-season Streamflow. These are now calculated based on environmental flows, which takes into account both endangered aquatic species such as the steelhead trout and the rates of streamflow. The Wet-season streamflow indicator scored an 87 (Good), and the Dry-season indicator scored a 67 (Fair). The River to Floodplain Connectivity indicator is now calculated based on elevation models by comparing the floodplain height to twice the bankfull stage height (the height on the bank at which water begins to flood from the channel). If they are the same height then CRWC considered the river to be connected to the floodplain. This indicator scored a 32 (Severely Impacted), however, the Carmel River FREE project plans to widen parts of the floodplain to increase connectivity and reduce flooding in some parts of Carmel. CRWC and the CSU Monterey Bay Watershed Institute are working to create a new indicator that monitors threatened native species such as the California red-legged frog. Overall the Carmel River watershed is still classified as “fair” with a total score of 65. For more information, visit www.carmelriverwatershed.org. 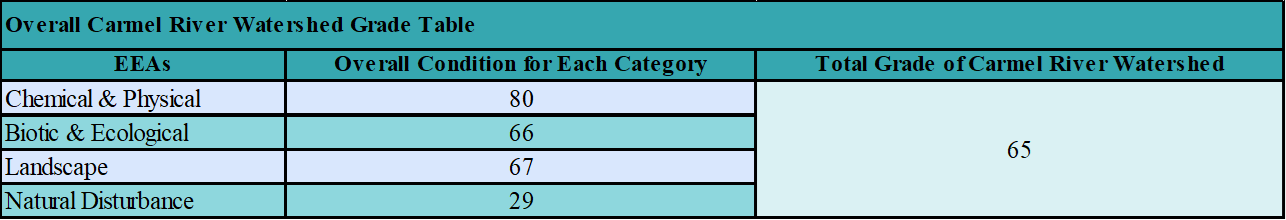
0 Comments
Leave a Reply. |

 RSS Feed
Carmel River Watershed Conservancy, 225 Crossroads Blvd Suite 322, Carmel, California 93923, United States
[email protected]
[email protected]
Header Images © Luciane Coletti. All rights reserved.
© Carmel River Watershed Conservancy. All rights reserved.
© Carmel River Watershed Conservancy. All rights reserved.